An interface engine fails quietly. A web server that goes down produces an error page somebody screenshots within minutes. A Mirth Connect channel that stops does nothing at all. Orders sit in a queue, results never post, and the first report is a phone call from a clinic asking where the morning’s labs are.
Alerting is how you hear about it first, and most of the work is design rather than tooling: what to watch, which rules catch which failures, what each severity promises, and how the alert travels when the server sending it is the thing that broke. This guide covers all four for Mirth Connect, OIE, and the other engines built on the same codebase. The examples use OpenShare’s Mirth Connect monitoring, and the principles hold for any stack, including one you build yourself.
The six signals worth alerting on
Most engine incidents show up in one of six places. Alert on these and you will catch nearly everything. Alert only on CPU and “is the process up” and you will catch almost nothing.
| Signal | What it catches | Typical urgency |
|---|---|---|
| Channel state | A channel stopped or paused when it should be running | Immediate |
| Queue depth and growth | A destination that stopped accepting, upstream of a visible failure | Minutes |
| Error ratio | Bad messages, mapping failures, a partner who changed a format | Minutes to hours |
| Message silence | A feed that normally flows but has received nothing | Minutes to hours |
| JVM heap | Memory pressure that ends in a stalled or crawling engine | Hours |
| Disk on the engine host | Logs, file-connector folders, and backups filling the volume | Hours to days |
In production the message store usually lives in a separate Postgres or SQL Server database, so give that host’s disk an alert of its own. When the database is local, message storage is one more thing filling the engine’s volume.
Two of the six get skipped most often.
Queue growth beats queue depth. A queue of 400 messages might be a normal Monday morning or a disaster, depending on whether it is draining. The number that predicts an incident is the trend. A destination queue growing faster than it drains means the receiving system has slowed or stopped, and you are watching the backlog form. A static threshold still has value as a backstop, but the rate is the early warning.
Silence is a failure. A channel with zero errors and zero messages looks healthy on every dashboard. If that channel normally carries a continuous ADT feed, zero messages means the upstream interface is down, and nobody on your side did anything wrong. Silence detection (no data in N minutes on a feed that should always have data) is the only way to catch a failure that happened on somebody else’s server.
Three classes of failure
The six signals fail at three different tempos, and the tempo decides how an alert should behave.
Hard-down. A channel is stopped or the engine is unreachable. Binary, unambiguous, and urgent, because every minute of downtime is a minute of backlog. These are the easy alerts to write and the worst ones to miss.
Degrading. Nothing is down yet, but a queue, an error ratio, or heap is trending toward down. Catch these and you fix the problem before it becomes a hard-down, often before anyone downstream notices.
Silent. Everything on your server is green and nothing is arriving, because the failure happened upstream and your engine was never contacted. Only the absence of traffic gives it away.
If your current setup only covers the first class, you have alerting for the failures you would have noticed anyway.
How teams alert on Mirth today
Datadog, New Relic, and CloudWatch will happily monitor the JVM that Mirth runs in. They will tell you the process is alive, the heap is fine, and CPU is at 12%, all of which can be true while a stopped channel starves a downstream system for hours. An engine with forty channels is really forty small applications sharing a JVM, and that channel layer is invisible to infrastructure monitoring. Keep the engine host in your APM if you run one. Channel-level alerts have to come from somewhere else.
For open-source Mirth Connect (4.5.2 and earlier) and OIE, that somewhere is one of four do-it-yourself approaches. All four work, and each has a ceiling. Licensed Mirth Connect adds a commercial option from NextGen, covered after them.
The Administrator dashboard
The desktop client’s dashboard shows channel state and message statistics, live, for the server you are connected to. It is the first thing everyone uses. Its limits are structural: one server at a time, only while a human has it open, and no history. Nobody is watching the dashboard at 2 a.m., which is when the queue starts growing.
Polling the REST API
The engine’s REST API exposes channel status and statistics, so a script hitting /api/channels/statuses on a schedule can detect stopped channels and rising error counts and push the result anywhere you like. /api/system/stats returns heap and disk in the same poll. This is the most common serious approach, and a well-built polling script covers a lot.
The costs are ongoing rather than up-front. You now own a monitoring application: state tracking so you alert on transitions instead of re-alerting every poll, history storage if you want trends, escalation logic, and a per-server deployment of all of it. The script also runs somewhere, and that somewhere needs watching too.
It needs a login, too. Open-source Mirth has no user roles, so the account a polling script stores is effectively an admin account, on the same API that our post on the September 2026 Mirth Connect vulnerabilities tells you to fence. Give the script an account of its own, and keep port 8443 on a management network that the script can reach and the internet cannot.
A metrics stack: Zabbix, Prometheus, Grafana
A JMX exporter pulls JVM metrics into a proper time-series stack, which gets you real dashboards, history, and alerting rules. If your organization already operates Prometheus or Zabbix at scale, extending it to the engines is a defensible choice.
The gap is that JMX carries JVM metrics only. The engine registers no channel metrics there, so per-channel queue depth, error ratios, and lifecycle state have to come from the REST API. You either adopt one of the small, mostly unmaintained community exporters or write your own, which puts you back in the polling-script business with a nicer dashboard on top. The stack is also real infrastructure with its own upgrade and on-call burden, a strange trade if the engines are the only reason to run it.
Built-in alerts and alert channels
Mirth’s own Alerts feature is where most admins start. An alert watches chosen channels for error types (source, destination, response, processing and so on), optionally filtered by a regex, and sends email through the server’s SMTP settings or hands the error to another channel. It fires on errors only, so a stopped channel, a growing queue, or a silent feed raises nothing. The other common pattern is a home-built alert channel that receives error events from other channels and sends email through an SMTP destination. Both are free and need no outside infrastructure.
Their shared failure mode is that the engine is alerting on itself. When the JVM dies, the disk fills, or the whole VM goes down, the alerts die with it. In-band alerting can tell you about sick channels. It cannot tell you the engine is dead.
Mirth Command Center, for licensed Mirth 4.6 and later
Commercial licenses for Mirth Connect 4.6 and later include NextGen’s Mirth Command Center from the entry Enterprise tier up, for US customers. It gives one view of channel metrics (received, queued, filtered, errored, processing time) across your registered servers and can email you when error, queue, or inactivity thresholds are reached. NextGen also sells an Advanced Alerting extension that adds metric, exception, and state-based alerts on channels and connectors. If you already pay for Mirth, start there. Its ceiling is the license: it covers commercial Mirth only, with nothing for OIE or the open-source builds.
The out-of-band principle
The failure mode of built-in alerts generalizes into the one rule to design around: an alert path must survive the failure it reports.
Apply it as a checklist against whatever you run today:
- If the engine process dies, does anything tell you? (Built-in alerts and alert channels: no.)
- If the whole host dies, does anything tell you? (A polling script on the same host: no.)
- If the network path between the engine and your alert destination breaks, does anything tell you?
- If the thing doing the watching dies, does anything tell you?
Heartbeat designs answer these correctly. The engine reports in continuously, and an independent observer alerts on the absence of the report. This inverts the in-band pattern, where silence is exactly what you cannot detect.
Many servers, one view
Almost nobody runs one engine. A production and a test server is the floor. Add a second site, a DR instance, or a per-facility deployment model and five to ten engines is normal. Every do-it-yourself approach above is per-server, so whatever you built, you built N times, and the answer to “is everything okay?” is N dashboards or N inboxes.
The question an integration manager asks in the morning is “which of my servers needs attention today?” That question wants one page: every server, online or not, health at a glance, active alerts on top.
Four rule types
Whatever stack you use, four rule mechanisms need to exist somewhere, and they line up with the three failure classes almost one to one. OpenShare evaluates alert rules on a 30-second cycle and has all four.
| Rule type | Fires when | Catches | Example |
|---|---|---|---|
| State change | A channel is in a target state | Hard-down | Channel → Stopped |
| Threshold | A metric crosses a fixed line | Degrading (backstop) | Queue depth > 100, heap > 85% |
| Rate of change | A metric climbs against its own baseline | Degrading (early) | Error spike against the recent baseline |
| Absence | No data arrives in the window | Silent | No messages in 30 min |
Threshold and rate-of-change are partners. The rate rule is the early warning. It fires while the error spike is forming, when the fix is a five-minute conversation with the partner who changed a field. The threshold is the backstop that catches slow drifts a rate rule never sees. Run both on the same metric with different severities: rate fires a warning, threshold fires the page. Point a rate-of-change rule at queue depth and you have the queue-growth signal from the top of this guide, as a rule you add yourself rather than a shipped template.
Absence windows have to match the feed. “No messages in 30 minutes” is right for a continuous ADT feed and absurd for a batch interface that runs at 6 a.m. Set the window from the feed’s real cadence, per channel, or the rule becomes your noisiest one. It is also the rule people skip because their tooling makes it awkward, and it is the only one that catches the silent class.
Severity is a promise
A severity level is a promise about what the recipient should do, and the promises have to be kept or the levels mean nothing.
- Critical means act now, whatever the hour. Data is not flowing, or will stop flowing without intervention. Channel stopped on a production feed. Engine offline. Disk nearly full.
- Warning means look during working hours. Queue elevated but draining. Error ratio up. Heap high but stable.
- Info is for the timeline: state transitions you want on record. Give Info rules no destinations, because severity by itself does not suppress delivery.
The test for critical: if the on-call person would be right to roll over and go back to sleep, it is not critical. Every critical that turns out to be ignorable teaches the team to ignore criticals, and that lesson is very hard to unteach. When in doubt, demote.
Two mechanical settings do a lot of the fatigue work:
- Cooldown. A sustained condition should notify once, not once per evaluation cycle. OpenShare notifies when a rule starts firing and again when it resolves, and the per-rule cooldown (15 minutes on a new rule, 15 to 60 on the shipped templates) stops a flapping condition from re-notifying every time it crosses back over the line.
- Silencing. Planned maintenance should not page anyone. Silencing a rule for a fixed duration keeps it evaluating and recording to the timeline while suppressing the server’s own notifications. If your maintenance process is “ignore alerts tonight”, you are teaching the team to ignore critical alerts.
Scope rules to intent
A rule that watches everything mostly watches things you don’t care about. The 30-minute absence window that is right for the ADT feeds is wrong for the lab feed and meaningless for the on-demand query channel.
Scoping by channel group rather than by individual channel is the maintainable version. Define a rule against “all ADT feeds”, and a channel added to that group next quarter is covered on the next evaluation cycle without anyone editing the rule. In OpenShare, group membership resolves dynamically for exactly this reason. Server-level metrics (heap, disk, load, threads) stay server-scoped, since a per-channel heap alert does not mean anything.
Delivery: the path matters as much as the rule
A good rule with a fragile delivery path is still a silent failure. Four questions to ask of whatever you run:
Does the alert survive the failure it reports? This is the out-of-band principle applied to delivery: at least the hard-down alerts must be sent by something other than the engine itself. In OpenShare, each rule picks one email source. Local means the server sends through its own destinations (fast, free, and dead when the server is). OpenShare Cloud means the platform emails the server’s owner or organization members who have monitoring alert emails turned on. A rule can also send no email and rely on its other destinations, and it never double-sends. Engine death itself is caught on the cloud side: when a server stops reporting, the platform emails you, and no rule on the dead engine has to fire.
Does the alert reach a system, or only an inbox? Email is where alerts go to be archived. For anything critical, a webhook into your paging or ticketing tool (or an MQTT message into your own automation) is the difference between being notified and having the problem handled. Webhook and MQTT destinations fire regardless of the email setting.
Who gets it? Named individuals beat a shared alias. A distribution list nobody owns becomes an inbox filter within a month.
What does it carry? Keep PHI out of alert emails and pager messages. Email, chat, and paging services often sit outside your BAA, and a built-in Mirth alert whose template includes the error text can carry message content along with it. OpenShare’s alert payloads carry the rule, severity, state, metric value, and threshold, and no message content.
A starting rule set
For a typical production engine, this is the set we deploy first and tune from. OpenShare ships these as templates in the rule drawer. They arrive disabled, so you enable the ones that fit and adjust thresholds and severities per feed. The same recipes translate to any stack.
| Template | Type | Condition | Severity |
|---|---|---|---|
| Channel Stopped | State change | Channel → Stopped | Critical |
| No Messages (30 min) | Absence | No data in 30 min | Warning (Critical on feeds a clinician waits on) |
| Error Spike | Rate of change | Errors spiking against the recent baseline | Warning |
| High Error Rate | Threshold | Error rate > 5% | Critical |
| Queue Depth Warning | Threshold | Queued > 100 | Warning |
| JVM Heap High | Threshold | Heap > 85% | Warning |
| Disk Usage High | Threshold | Disk > 85% | Warning (Critical once you have watched a volume fill) |
Then iterate with one habit. At the end of each week, look at what fired and ask which notifications led to an action. Anything that repeatedly did not gets demoted, re-scoped, or deleted. An alert set is never finished, but it converges fast if someone owns it.
Alert events in OpenShare are kept for 90 days with the rule, condition, and scope attached to each event. That weekly review becomes a short scroll: expand the event, jump to the metric at the moment it fired, decide, move on.
What this looks like in OpenShare
OpenShare is our browser console and exchange layer for Mirth-family engines, and monitoring is one of its six core capabilities. It is the out-of-band design described above, built in. The plugin on each engine streams metrics and lifecycle events up, and the cloud side watches for the stream to stop.
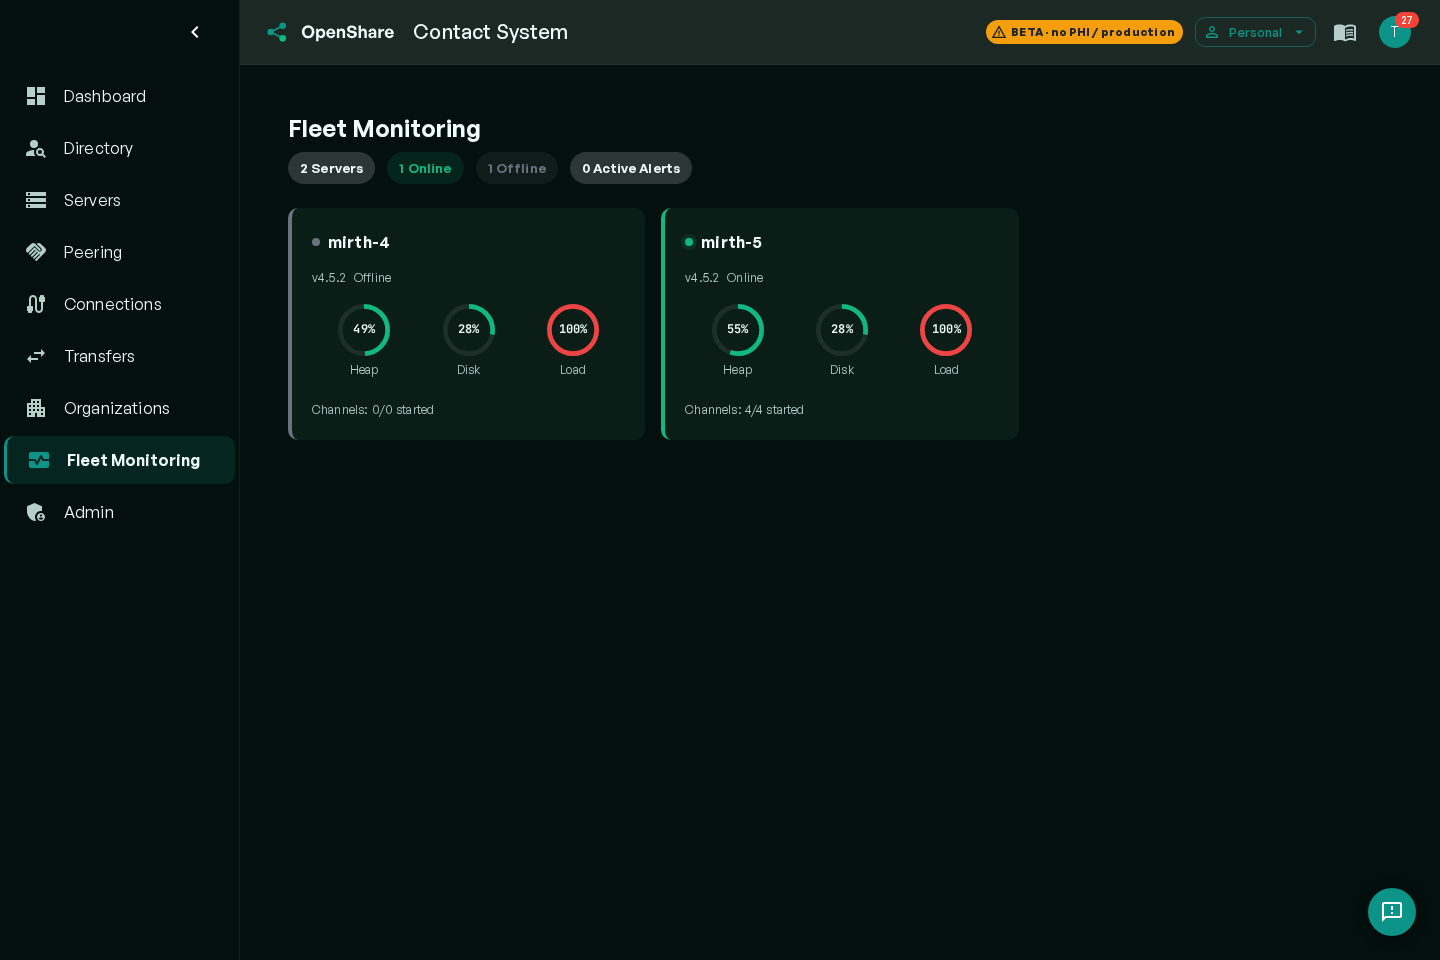
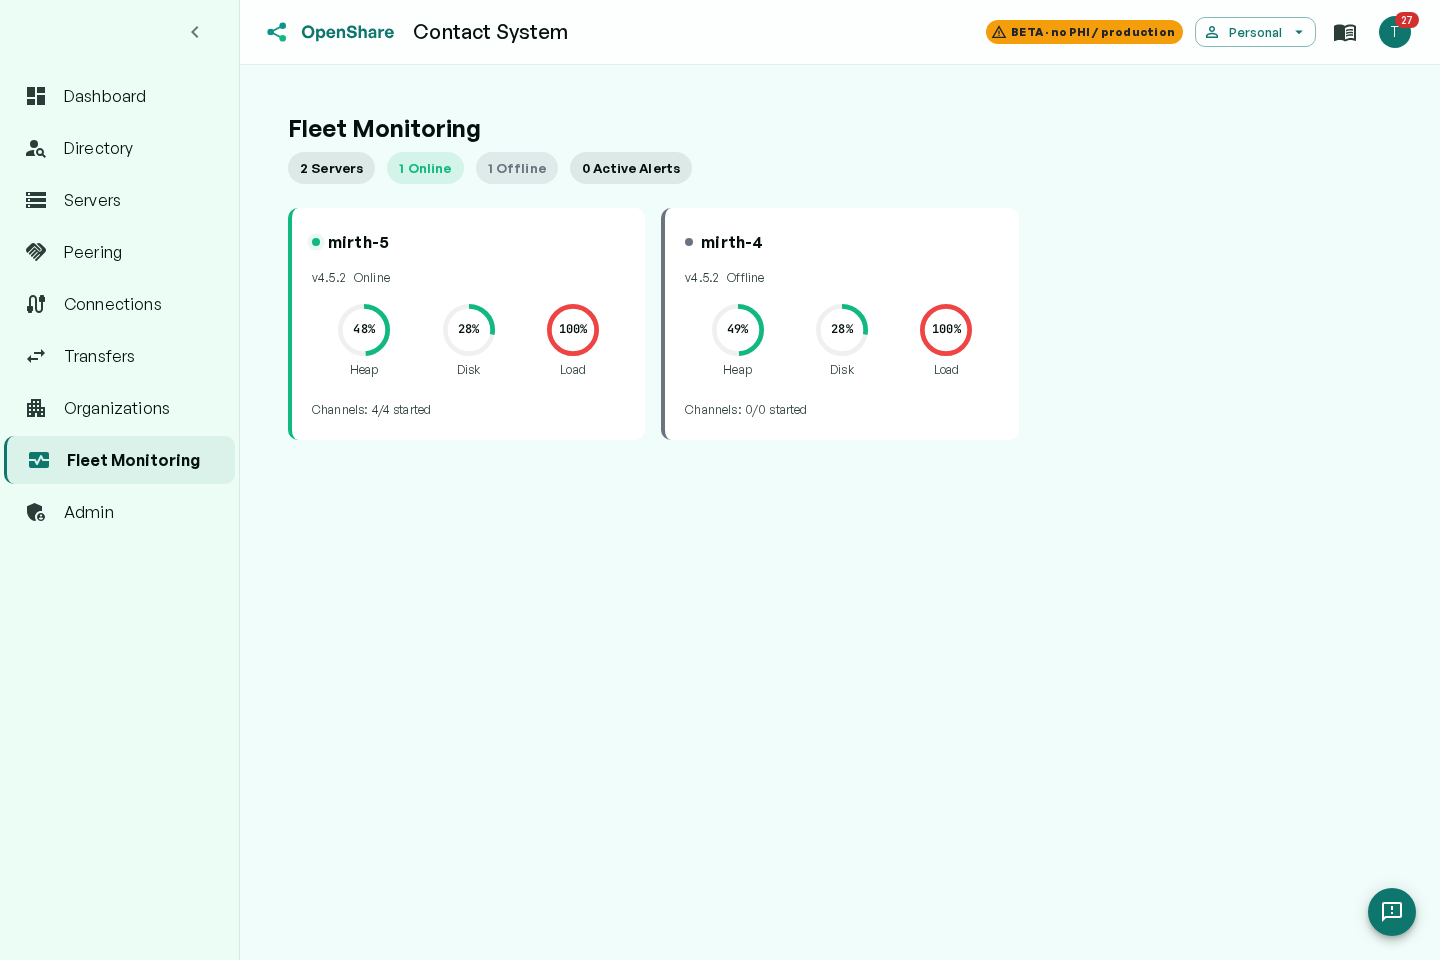
- Fleet dashboard. One page for every server with cloud sync enabled: online status, uptime, heap/disk/load gauges, started-channels count, and an alert badge per server, with summary chips across the top. Offline servers are called out rather than left blank.
- Server detail and metric history. Drill into any server for stat cards and a metric explorer. Chart any metric over the last hour, day, week, or 30 days, or a custom range, overlay several, and save the combinations you keep coming back to.
- Alerting as this guide describes it. The four rule types on all six signals, severities, cooldown, silencing, channel-group scope, the starter templates, cloud email, and webhook and MQTT destinations.
- Metrics only, by design. The monitoring path carries counts, percentages, timestamps, and lifecycle events. Message content is never accessed, stored, or transmitted, so the monitoring data itself carries no PHI.
It works from the first connection. Install the plugin on an existing Mirth Connect or OIE server, or start from OpenShare Engine, the patched OIE build on our Mirth Connect download page. Then enable cloud sync, sign in from a browser, and the fleet page starts filling in. Monitoring and alerting are not tier-gated: they are included free on the servers you run, and the free tier covers the servers you need to get started. Larger fleets move to a paid tier.
Where to start, whatever you use
Alert on the six signals, make queue growth and silence first-class, keep critical for failures that need someone now, and get at least one alert path out-of-band so a dead engine can still reach you. A polling script that does those things beats an expensive stack that does not. When critical means critical, people answer at night without resentment, and when the silent class is covered, nobody finds out about yesterday’s lab feed outage from the lab.
If you would rather not build it, create a free OpenShare account, connect a server, and start from the templates. The fleet view is live the same afternoon. For help with the engine side (upgrades, migrations, or tuning a rule set against your actual estate), our Mirth Connect team does this every day.