An interface engine fails quietly. A web server that goes down produces an error page somebody screenshots within minutes. A Mirth Connect channel that stops does nothing at all. Orders sit in a queue, results never post, and the first report is a phone call from a clinic asking where the morning’s labs are.
Monitoring an integration engine is a different problem from monitoring an application, and generic tooling mostly misses it. This guide is about what to watch on a Mirth Connect or OIE server and how to watch it without building a second job for yourself. It applies equally to Mirth Connect, OIE, and the other engines built on the same codebase, which share the same architecture and the same blind spots.
The six signals that matter
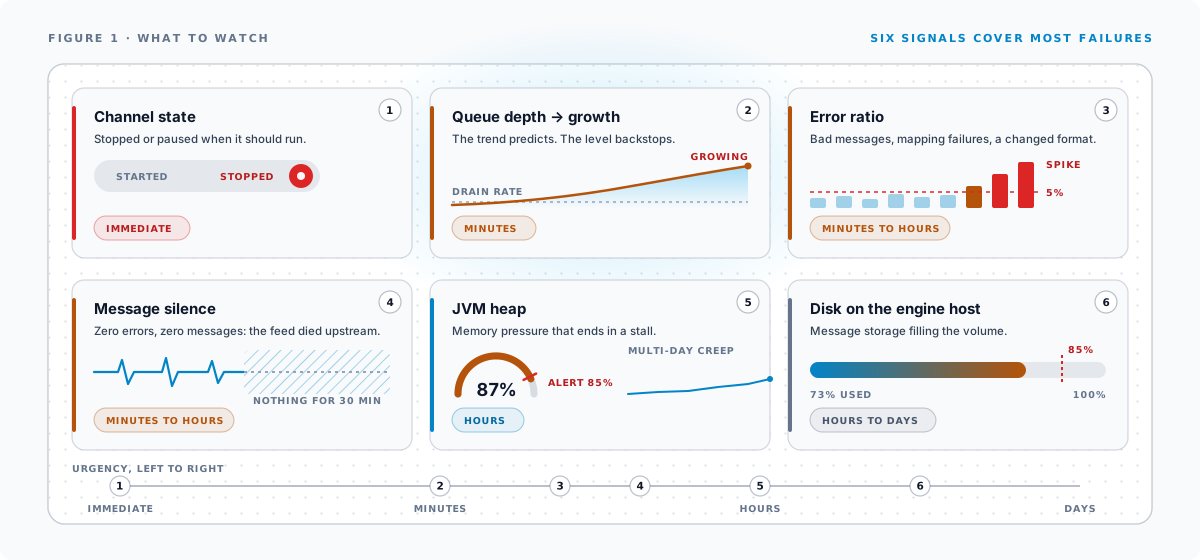
Most engine incidents show up in one of six places. Watch these and you will catch nearly everything. Watch only CPU and “is the process up” and you will catch almost nothing.
| Signal | What it catches | Typical urgency |
|---|---|---|
| Channel state | A channel stopped or paused when it should be running | Immediate |
| Queue depth and growth | A destination that stopped accepting, upstream of a visible failure | Minutes |
| Error ratio | Bad messages, mapping failures, a partner who changed a format | Minutes to hours |
| Message silence | A feed that normally flows but has received nothing | Minutes to hours |
| JVM heap | Memory pressure that ends in a stalled or crawling engine | Hours |
| Disk on the engine host | The volume filling, usually with message storage | Hours to days |
Two of these get skipped most often.
Queue growth beats queue depth. A queue of 400 messages might be a normal Monday morning or a disaster, depending on whether it is draining. The number that predicts an incident is the trend. A destination queue growing faster than it drains means the receiving system has slowed or stopped, and you are watching the backlog form. A static threshold still has value as a backstop, but the rate is the early warning.
Silence is a failure. A channel with zero errors and zero messages looks healthy on every dashboard. If that channel normally carries a continuous ADT feed, zero messages means the upstream interface is down, and nobody on your side did anything wrong. Silence detection (no data in N minutes on a feed that should always have data) is the only way to catch a failure that happened on somebody else’s server.
Why generic APM tools miss engine failures
Datadog, New Relic, and CloudWatch will happily monitor the JVM that Mirth runs in. They will tell you the process is alive, the heap is fine, and CPU is at 12%. Every one of those can be true while a stopped channel starves a downstream system for hours.
The failures that matter live at the channel layer, and the channel layer is invisible to infrastructure monitoring. An engine with forty channels is really forty small applications sharing a JVM, each with its own state, its own queues, and its own error stream. Monitoring the container tells you the building has power. It does not tell you whether anyone inside is working.
APM still has a place here. Heap and disk belong in any setup, and if you already run an observability stack, keep the engine’s host in it. The stack needs channel-level data added, and that is where the DIY approaches come in.
The DIY toolbox
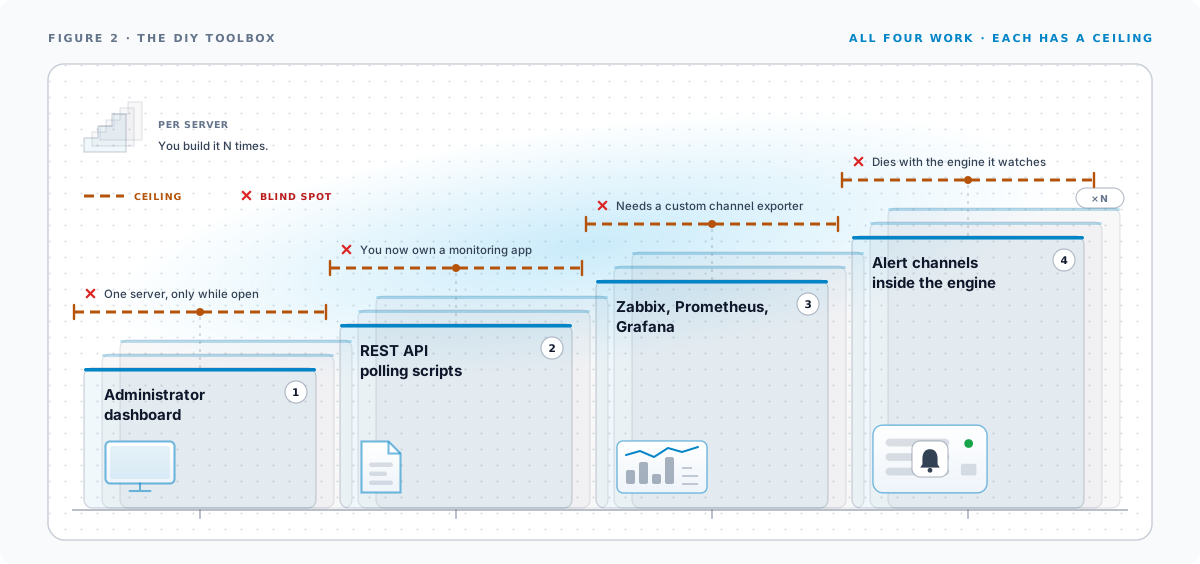
There are four ways teams bolt monitoring onto a Mirth-family engine themselves. All four work. Each has a ceiling.
The Administrator dashboard
The desktop client’s dashboard shows channel state and message statistics, live, for the server you are connected to. It is useful and it is the first thing everyone uses. Its limits are structural: one server at a time, only while a human has it open, and no history. Nobody is watching the dashboard at 2 a.m., which is when the queue starts growing.
Polling the REST API
The engine’s REST API exposes channel status and statistics, so a script hitting /api/channels/statuses on a schedule can detect stopped channels and rising error counts and push the result anywhere you like. This is the most common serious approach, and a well-built polling script covers a lot.
The costs are ongoing rather than up-front. You now own a monitoring application: state tracking so you alert on transitions instead of re-alerting every poll, history storage if you want trends, escalation logic, and a per-server deployment of all of it. The script also runs somewhere, and that somewhere needs monitoring too. Most polling setups decay into emailing someone’s inbox, which has a filter.
A metrics stack: Zabbix, Prometheus, Grafana
JMX exporters and community templates can pull engine and JVM metrics into a proper time-series stack, which gets you real dashboards, history, and alerting rules. If your organization already operates Prometheus or Zabbix at scale, extending it to the engines is a defensible choice.
The gap is that the useful channel-level data (per-channel queue depth, error ratios, lifecycle state) is mostly not sitting in JMX. Getting it into the stack means writing and maintaining a custom exporter against the REST API, which puts you back in the polling-script business with a nicer dashboard on top. The stack itself is also real infrastructure with its own upgrade and on-call burden, a strange trade if the engines are the only reason to run it.
Alert channels inside the engine
A popular pattern: build a Mirth channel that watches for errors (or receives events from other channels) and sends email through an SMTP destination. It is free, needs no external infrastructure, and every experienced Mirth admin has built one.
Its failure mode is that the engine is monitoring itself. When the JVM dies, the disk fills, or the whole VM goes down, the alert channel dies with it. In-band monitoring can tell you about sick channels. It cannot tell you the engine is dead.
The out-of-band principle
That last point generalizes into the one rule to design around: monitoring must survive the failure it reports.
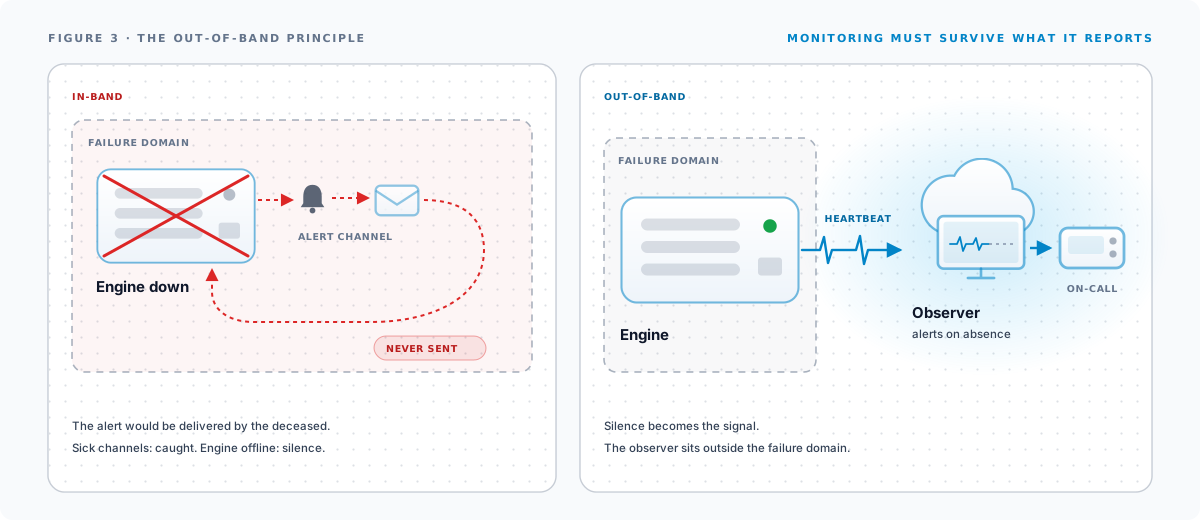
Apply it as a checklist against whatever you run today:
- If the engine process dies, does anything tell you? (In-band alert channels: no.)
- If the whole host dies, does anything tell you? (A polling script on the same host: no.)
- If the network path between the engine and your alert destination breaks, does anything tell you?
- If the thing doing the monitoring dies, does anything tell you?
Heartbeat designs answer these correctly. The engine reports in continuously, and an independent observer alerts on the absence of the report. This inverts the in-band pattern, where silence is exactly what you cannot detect.
The multi-server problem
Almost nobody runs one engine. A production and a test server is the floor. Add a second site, a DR instance, or a per-facility deployment model and five to ten engines is normal. Every approach above is per-server, so whatever you built, you built N times, and the answer to “is everything okay?” is N dashboards or N inboxes.
The question an integration manager asks in the morning is “which of my servers needs attention today?” That question wants one page: every server, online or not, health at a glance, active alerts on top.
What this looks like in OpenShare
OpenShare is our browser console and exchange layer for Mirth-family engines, and monitoring is one of its six core capabilities. It is the out-of-band design described above, built in. The plugin on each engine streams metrics and lifecycle events up, and the cloud side watches for the stream to stop.
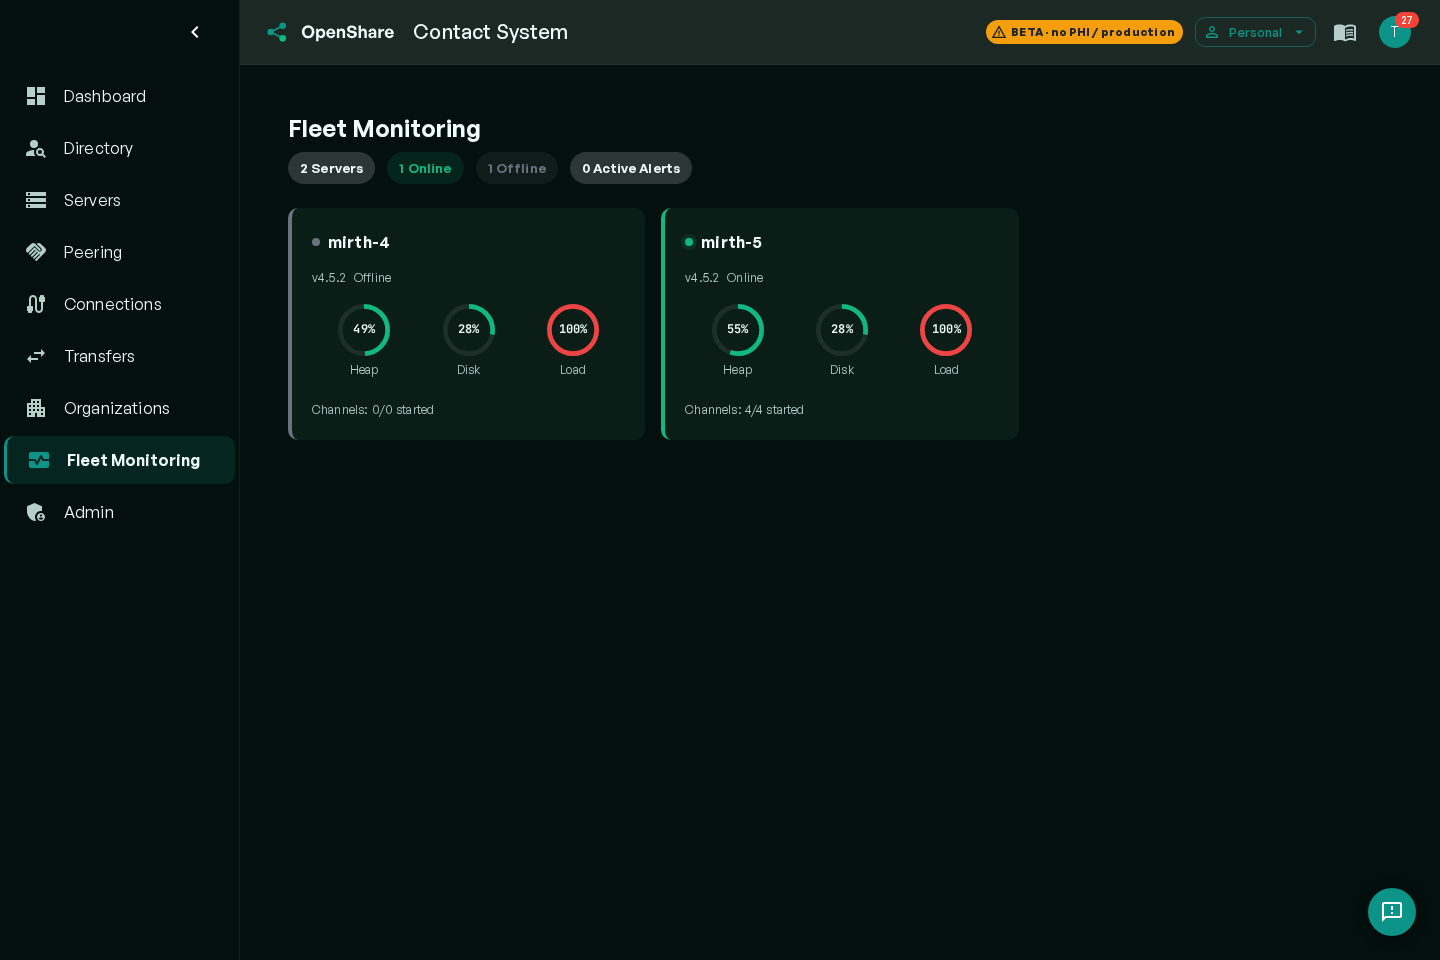
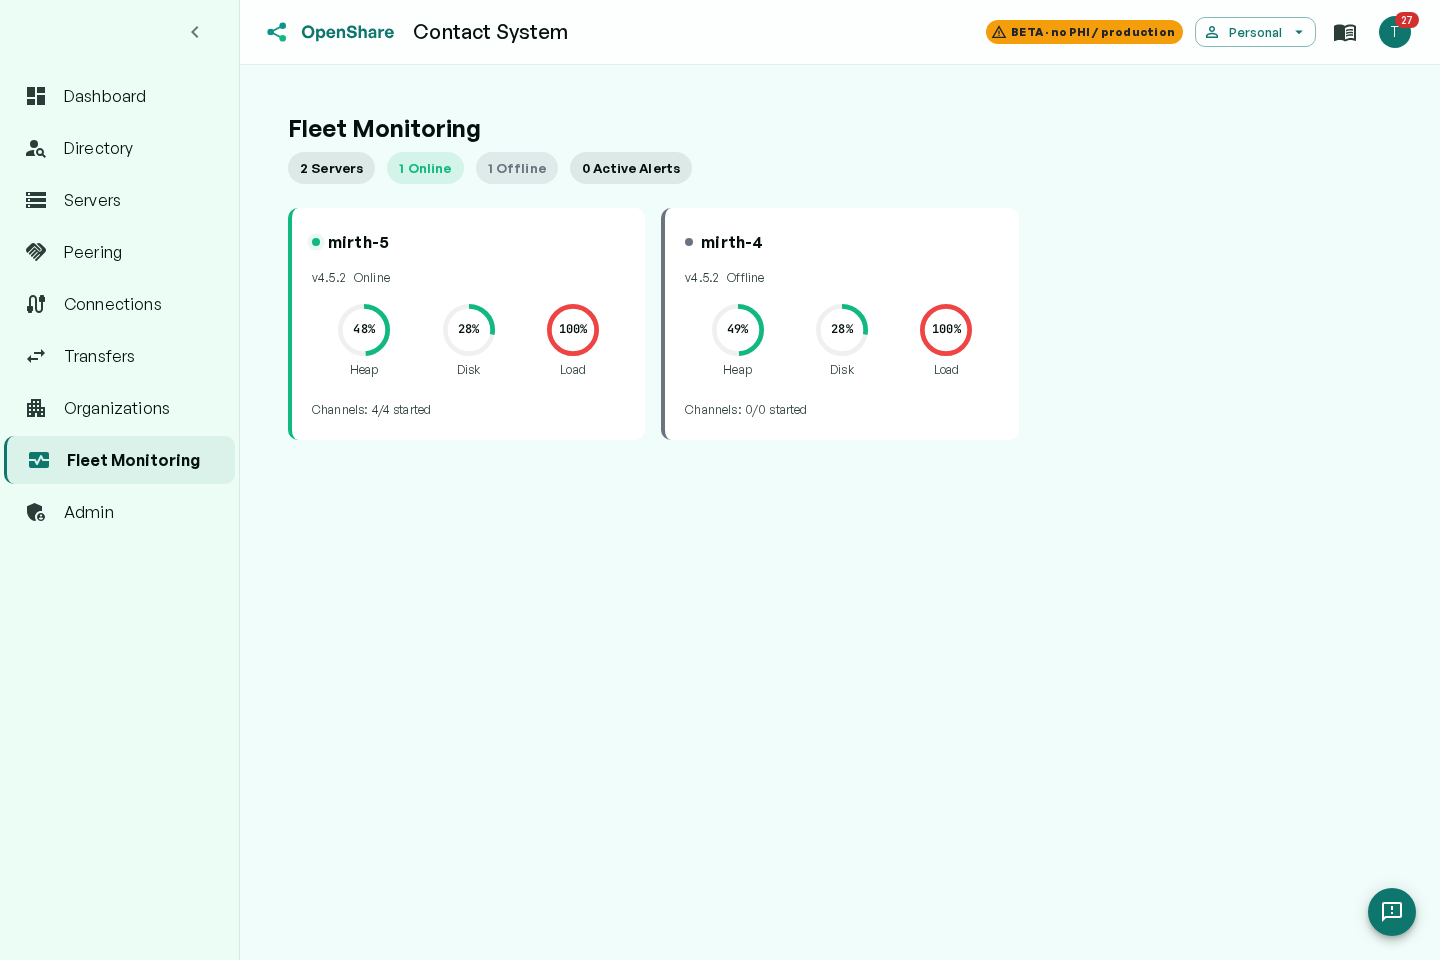
The pieces, mapped to this guide:
- Fleet dashboard. One page for every server with cloud sync enabled: online status, uptime, heap/disk/load gauges, started-channels count, and an alert badge per server, with summary chips across the top. Offline servers are called out rather than left blank.
- Server detail and metric history. Drill into any server for stat cards and a metric explorer. Chart any metric over the last hour, day, week, or 30 days, or a custom range, overlay several, and save the combinations you keep coming back to.
- Alert rules on all six signals. Threshold rules (heap above 85%, queue above 100), rate-of-change rules (an error spike against the preceding minutes), absence rules (no messages in 30 minutes), and state-change rules (channel stopped). A rate-of-change rule on queue depth gives you the queue-growth signal from earlier in this guide; you build that one yourself, since no shipped template covers it. Rules scope server-wide, to specific channels, or to channel groups. A companion post on alerting design, later in this series, covers how to use them without drowning in email.
- Delivery that does not depend on the engine’s mail path. A rule’s email can be sent by the server itself, by OpenShare Cloud, or not at all. Cloud delivery does not rely on the engine’s SMTP setup, and the platform separately emails you when a server stops reporting, which is the one alert a dead engine cannot send for itself. Webhooks and MQTT destinations are there for paging and automation paths.
- Metrics only, by design. The monitoring path carries counts, percentages, timestamps, and lifecycle events. Message content is never accessed, stored, or transmitted, so there is no PHI exposure to assess.
Monitoring works from the first connection: install the plugin on an existing Mirth Connect or OIE server (or use the Mirth Connect download that ships OIE with it), enable cloud sync on it, sign in from a browser, and the fleet page starts filling in. Monitoring is not tier-gated. A free account covers one server (two in a free organization), and larger fleets need a paid plan.
Where to start, whatever you use
Watch the six signals, make queue growth and silence first-class, and get at least one alert path out-of-band so a dead engine can still page you. A polling script that does those three things beats an expensive stack that does not.
If you would rather not build it: create a free OpenShare account, connect a server, and the fleet view is live the same afternoon. For help with the engine side (upgrades, migrations, channel work), our Mirth Connect team does this every day.